Live sales and guest insights, from every restaurant and ordering channel.
Sales across every channel
84,260 NOK
POS
Kiosk
Webshop
App
Preferred by the best restaurants
Every channel
One live view
Follow sales across your restaurants, from the counter to the kiosk, webshop and app.
Your restaurantAn example day
Sales
NOK 84,260
268 orders314.40 NOK per order
Sales
NOK 45,360
144 orders315.00 NOK per order
Sales
NOK 38,900
124 orders313.71 NOK per order
All locations, 84,260 NOK, 268 orders.
50k25k0
POS
1,760960800
Kiosk
44,00024,60019,400
Webshop
21,00010,80010,200
App
17,5009,0008,500
Live means right now
Follow sales, orders and basket size as they happen. Open the transactions behind every total.
Learn from your best service
Connect staff, preparation times and guest habits. Bring the lessons from your regulars to the next shift.
Give them a reason to return
Discover the dishes, offers and experiences your returning guests have in common, even without registration.
Understand the visit
Earn the next one
What do your regulars have in common?
Start with a question worth answering. Explore what returning guests choose, where they order and how the service differs, then use the pattern to plan your next improvement.
A lunch favourite brings them back
An example to investigate across locations and ordering channels. Could a member offer make that favourite an even better reason to return?
Compare guests with 10+ visits in three months with those who have not returned, even without a login or registration. See how basket size, ordering channels and payment methods differ, and use the patterns to shape a better next visit.
Guest insights with ninito Pro and Enterprise
Recognise repeat visits without a login. Explore group patterns while individual guest histories stay consent-based.
Regulars spend NOK 62 more per order in this example.
Average preparation time
Regular guests10+ visits in 3 months
7min
Not returned1 visit in 3 months
11min
A 4-minute difference. Compare dishes and busy periods to investigate.
Where each group orders
Share of orders in each channel. Regular guests have 10+ visits; the other group has one visit and has not returned in the selected three months.
Channel
Regulars
Not returned
Kiosk
50%
65%
Webshop
30%
18%
App
18%
15%
POS
2%
2%
Kiosk leads both groups. Regulars use your webshop more often.
Average order value. Regular guests, 286 NOK. Not returned, 224 NOK.
See the service behind repeat visits
Compare who served each group and how quickly their food arrived. Spot the staff and service patterns your regulars have in common, then bring those lessons to the guests you want to see again.
Compare what regulars order with dishes chosen by guests who have not returned. See which items sell together, then explore categories, extras and bundles alongside sales and product-cost margins to decide what to promote, improve or replace.
Example with 100 first-time guests per dish, followed for 30 days.
Chicken burger
42%returned
Falafel salad
64%returned
Compare their first orders. Find patterns worth exploring.
How soon do your guests come back?
Measure the average time between visits and compare it with your industry benchmark. Follow the gap as you improve your menu, service and offers, so you can see whether guests are returning more often.
Compare repeat visits before, during and after a campaign, whether it runs for a week or three months. Read purchases, basket size and offer use alongside returning guests to see what changed and plan your next campaign.
Example with 100 first-time guests per group, followed for 30 days.
Returned within 30 days
Before the offer42%
During the offer58%
After the offer54%
+12
more guests returned, per 100After the offer compared with before.
Be ready before the rush
Filter both frequent and non-returning guests by weekday and hour, including every Monday over the last six months. Compare their orders, products, staff sales and preparation times to plan the next rush with the right food and people ready.
Choose a day to see when your team needs to be ready.
Follow every total to the order
Compare restaurants and ordering channels, from the counter and kiosk to QR, webshop, app and connected delivery platforms. Follow group sales down to a location, product or individual transaction to see whether a change comes from more orders or larger baskets.
Your restaurants, togetherExample day, excluding VAT
Total sales across both restaurants
84,260NOK
268 orders · 2 restaurants
Choose a restaurantSales · NOK
Sales at City centre
45,360NOK
144 orders
3 recent ordersTotal · NOK
Order 1042
440NOK
Kiosk · 18.42 · City centre
What was orderedTotal · NOK
Chicken burger2 × 160 NOK320
House lemonade2 × 60 NOK120
Order 1041
200NOK
Webshop · 18.39 · City centre
What was orderedTotal · NOK
Falafel salad1 × 140 NOK140
House lemonade1 × 60 NOK60
Order 1040
360NOK
Kiosk · 18.36 · City centre
What was orderedTotal · NOK
Chicken burger1 × 160 NOK160
Falafel salad1 × 140 NOK140
House lemonade1 × 60 NOK60
Sales at Riverside
38,900NOK
124 orders
3 recent ordersTotal · NOK
Order 2087
400NOK
Kiosk · 18.44 · Riverside
What was orderedTotal · NOK
Falafel salad2 × 140 NOK280
House lemonade2 × 60 NOK120
Order 2086
220NOK
App · 18.40 · Riverside
What was orderedTotal · NOK
Chicken burger1 × 160 NOK160
House lemonade1 × 60 NOK60
Order 2085
300NOK
Kiosk · 18.37 · Riverside
What was orderedTotal · NOK
Chicken burger1 × 160 NOK160
Falafel salad1 × 140 NOK140
Keep the right figures close
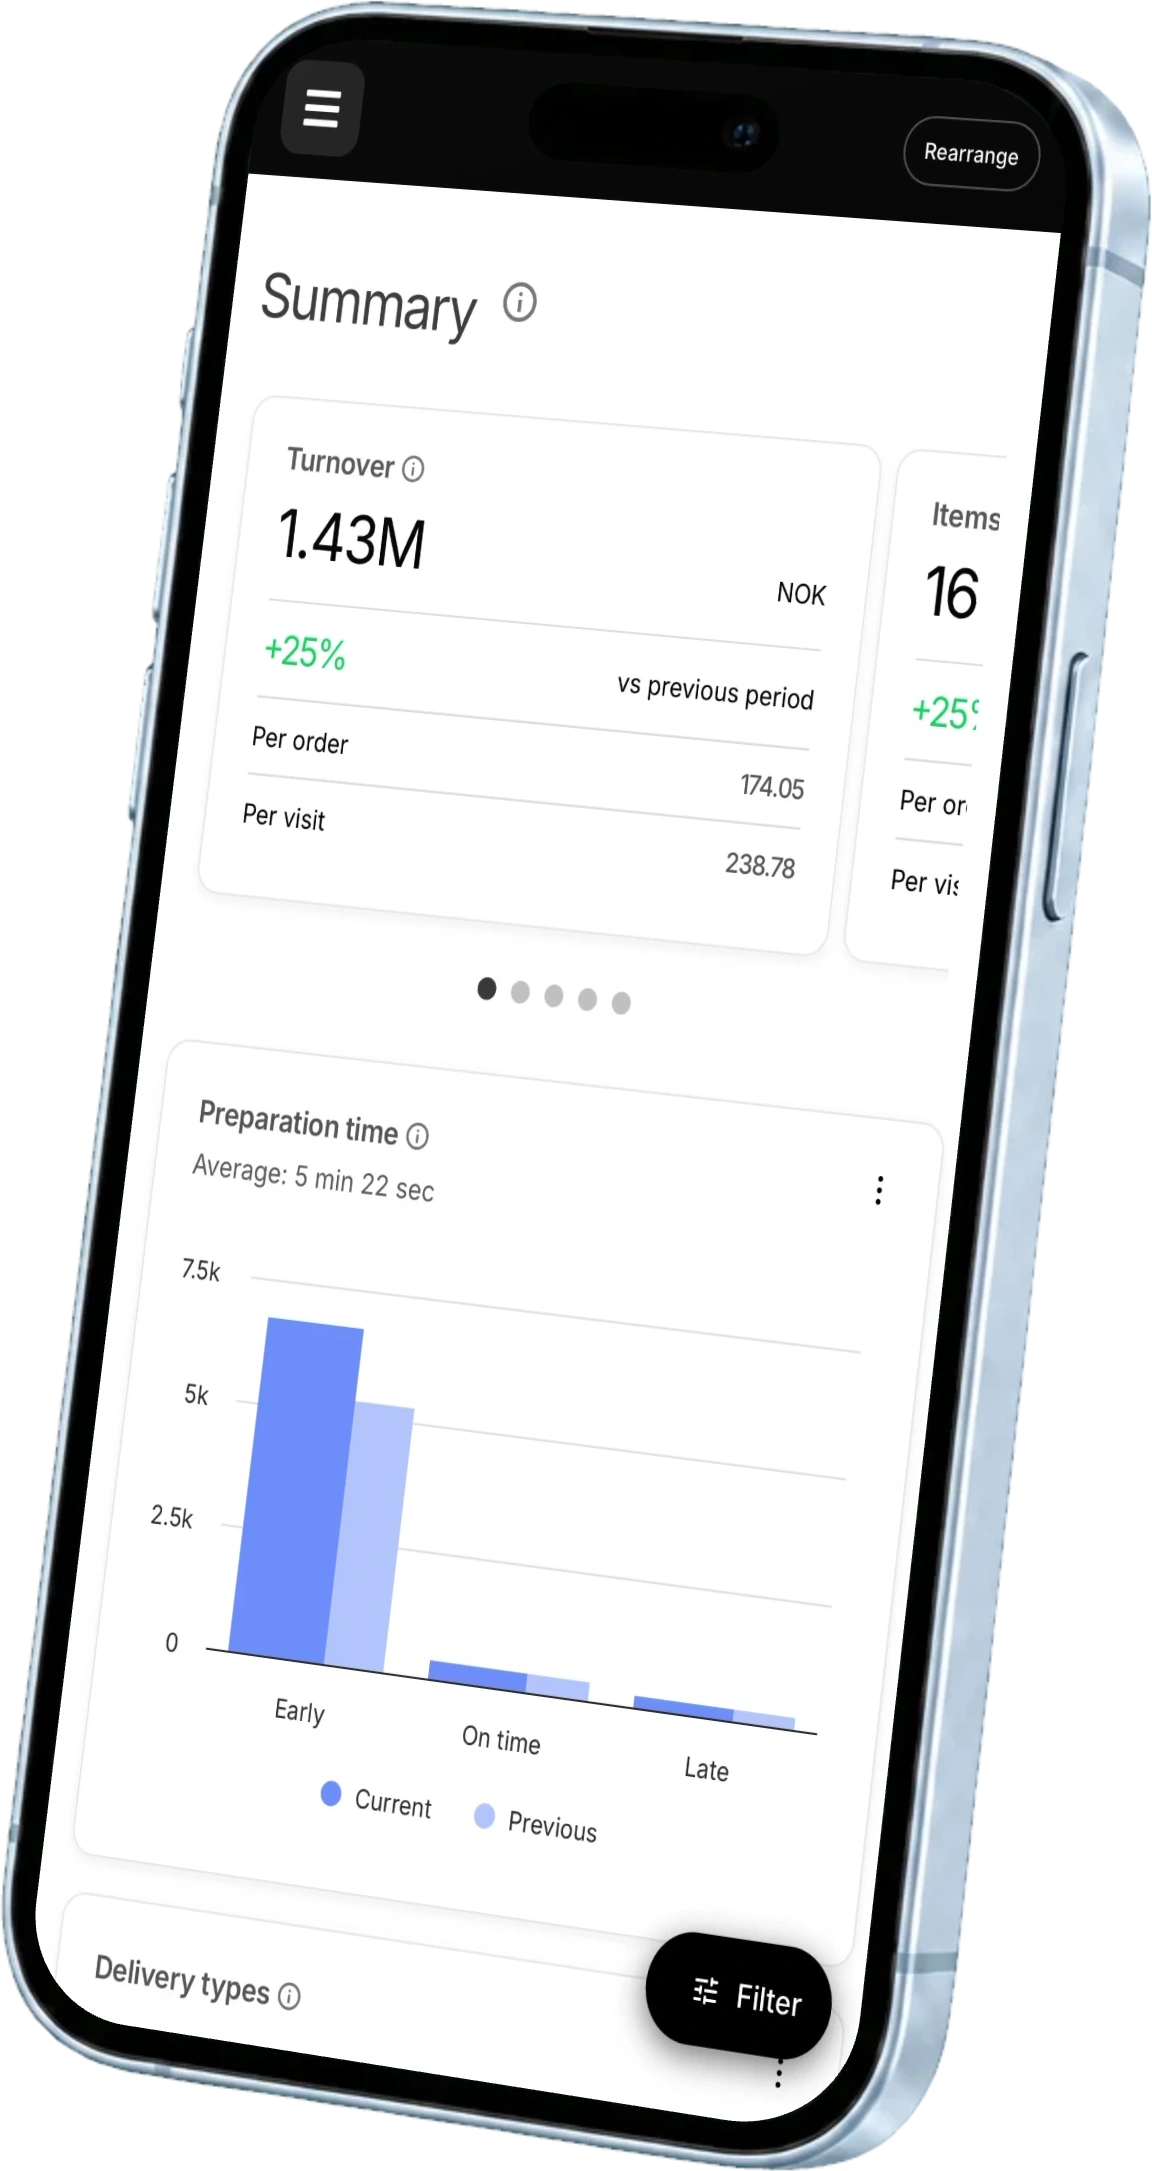
Give each manager access to the restaurants they run, with live key figures close in the ninito manager app. Take the analysis further with data exports, or connect your reporting tools through Enterprise APIs and webhooks.
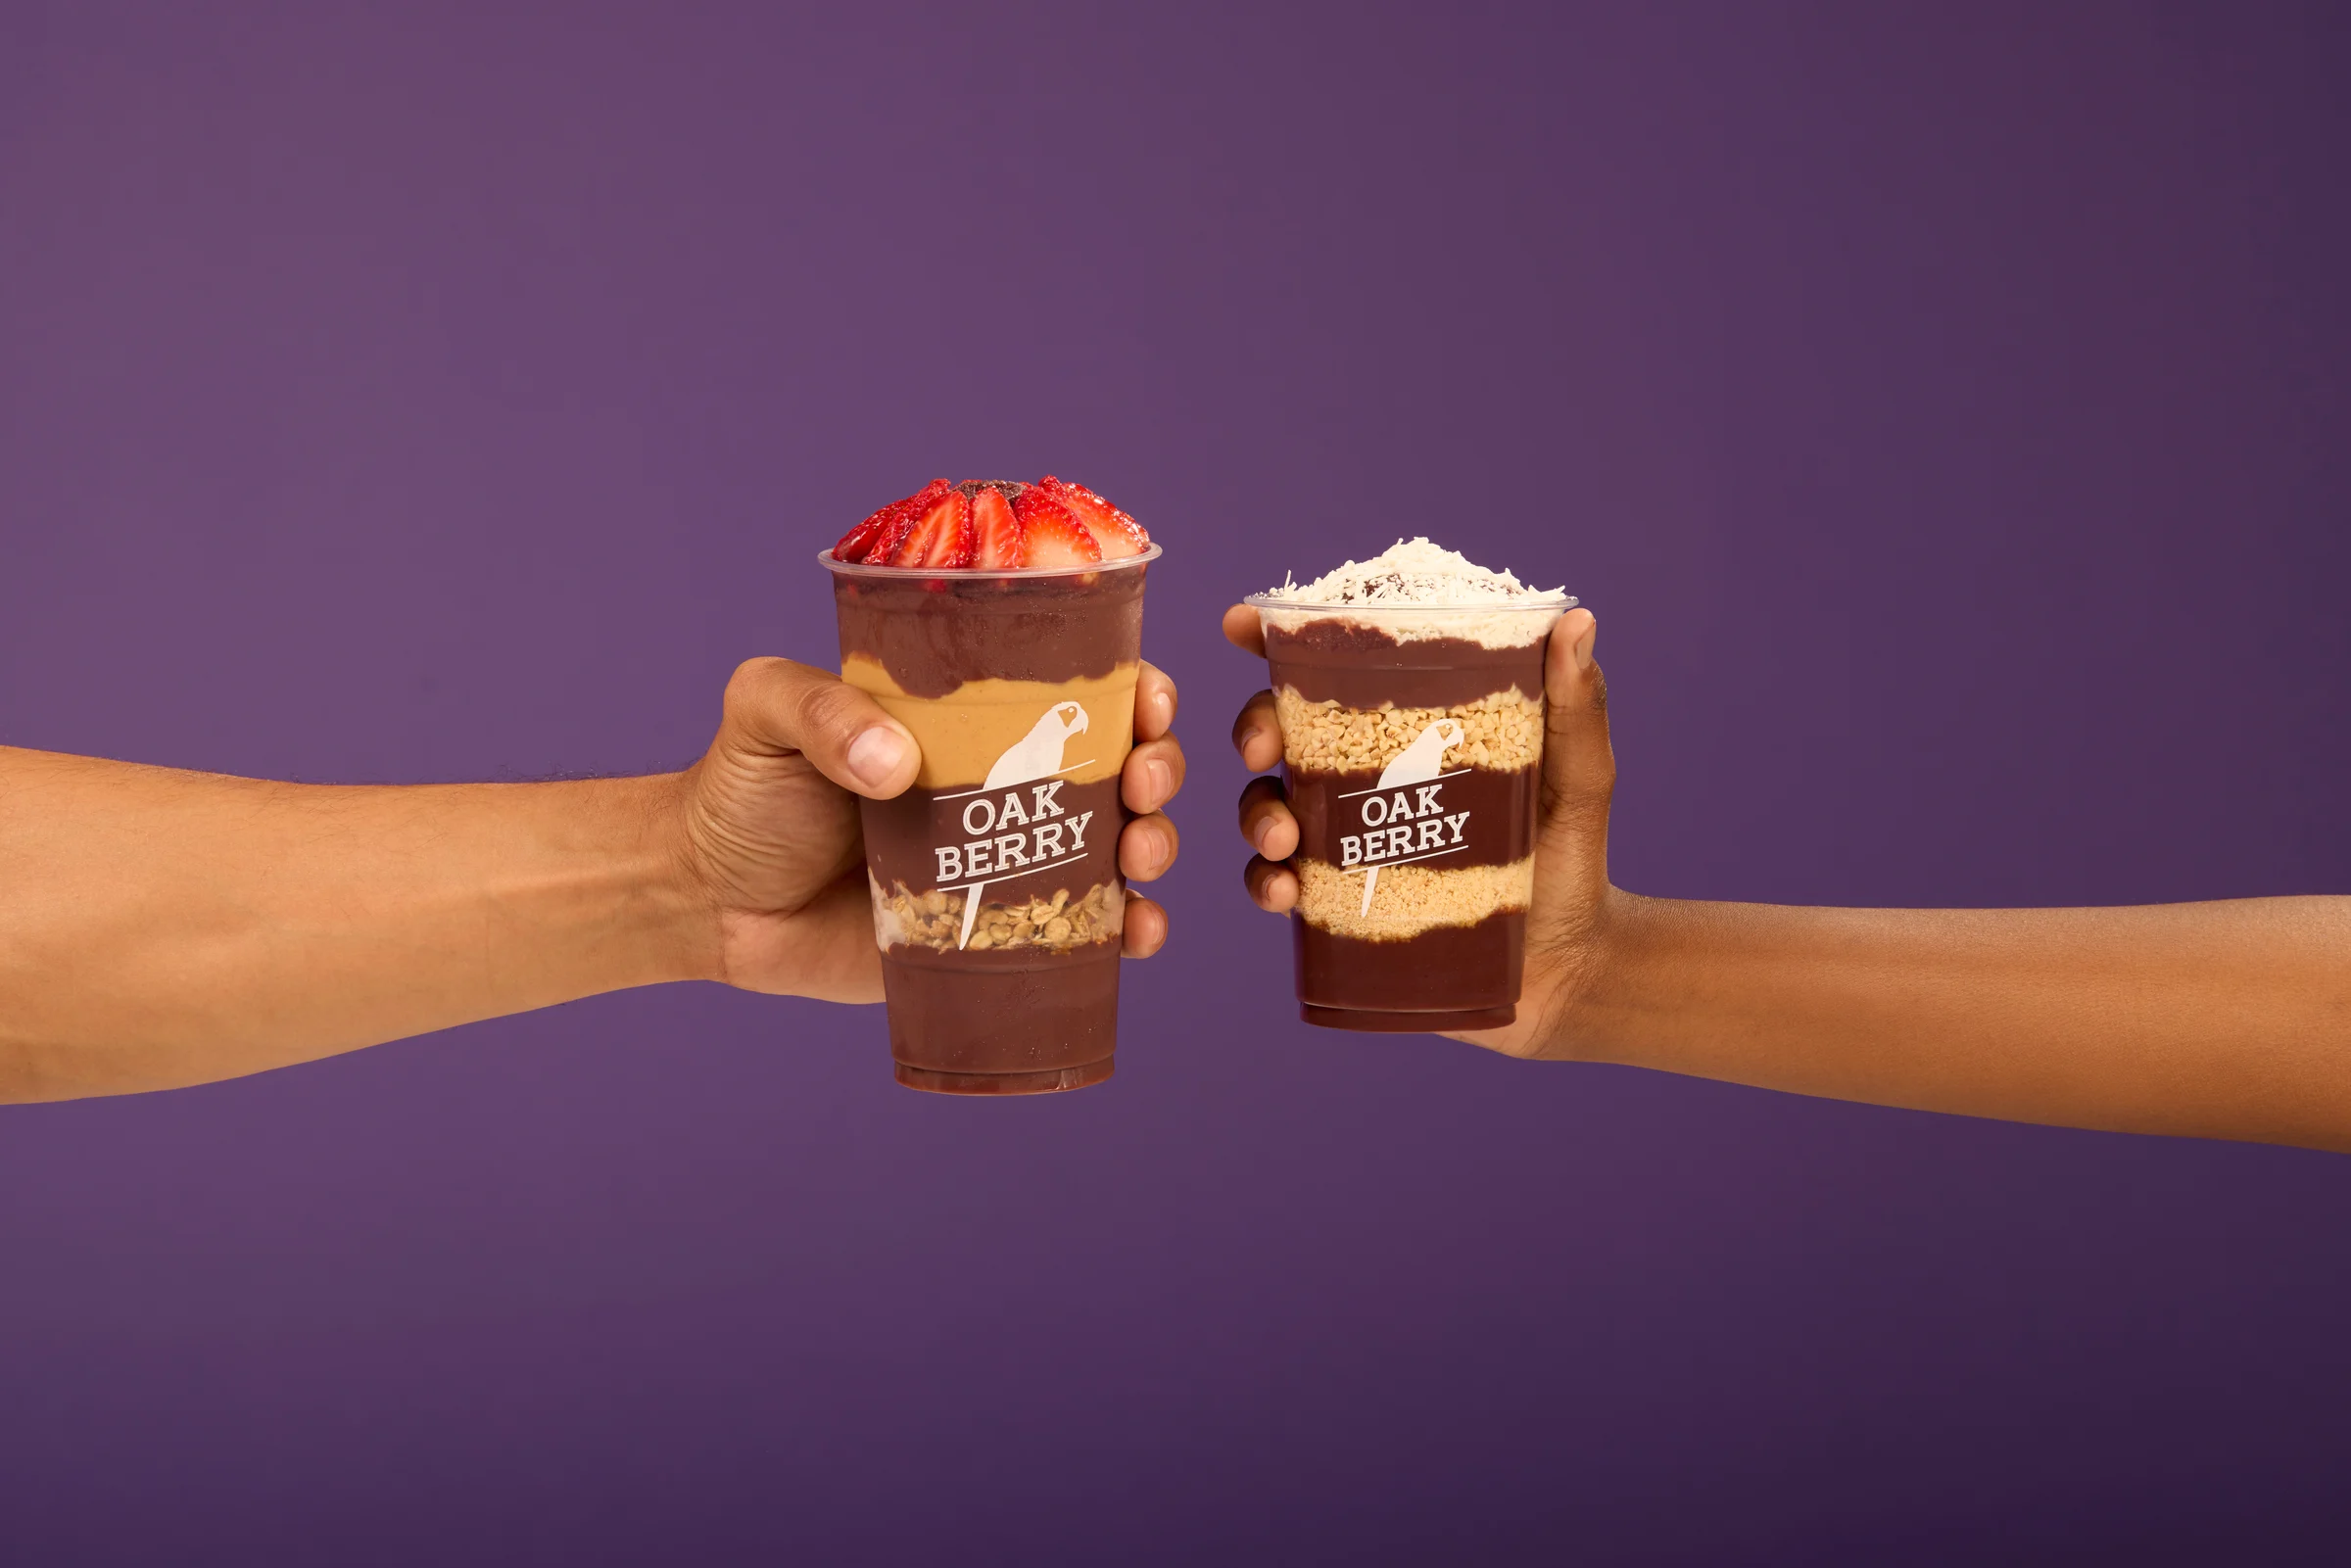
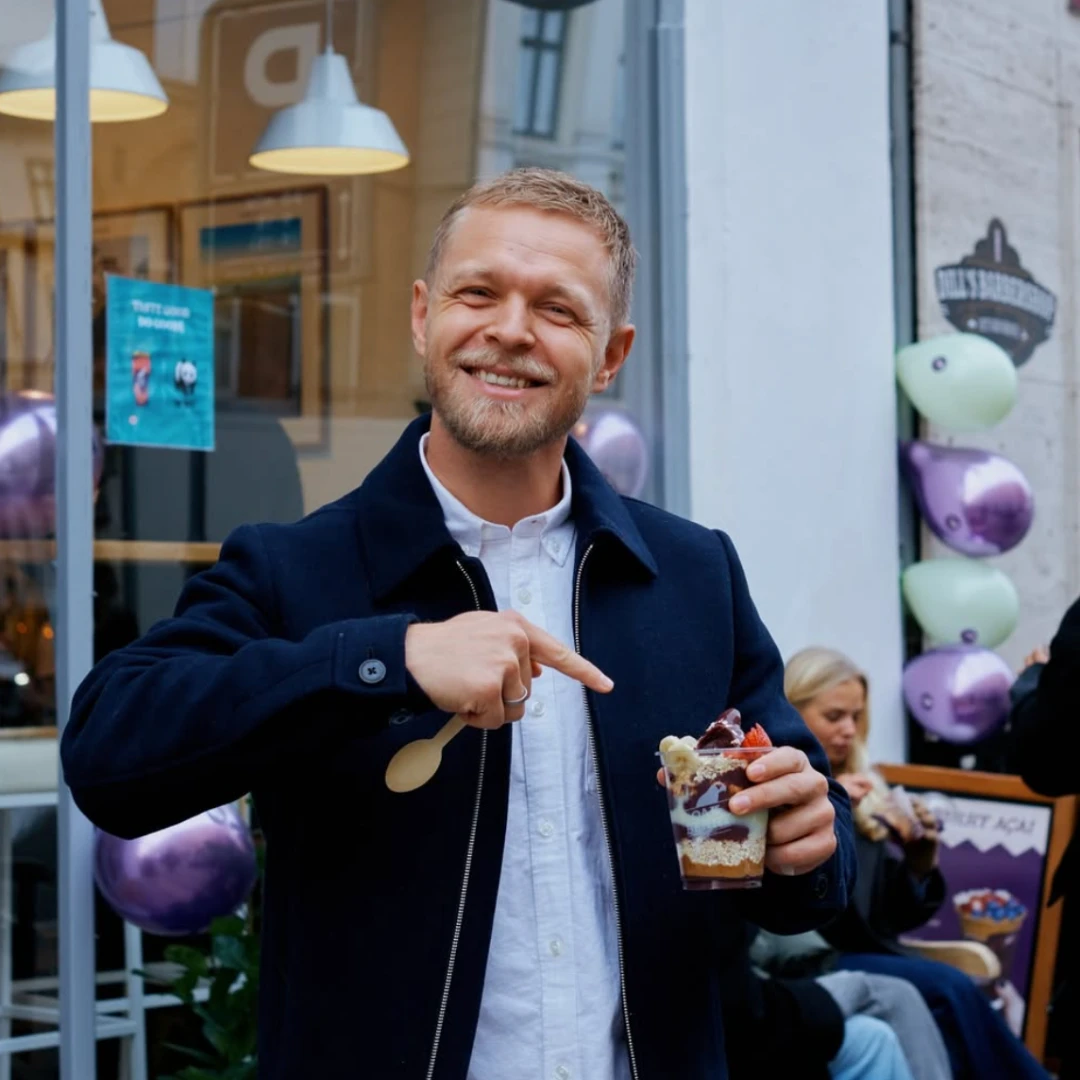
Oakberry used to collect figures from separate systems by hand. After bringing the operation into ninito, the team had less manual reporting and more time for the restaurant.
Oakberry Nordic brought separate systems together with ninito as it prepared to grow across Scandinavia. Shared sales insight and less manual administration give the team more time to focus on its stores and guests.
Connect sales, guest habits and daily operations in the same analysis. Explore revenue, orders, basket size, dishes, categories, customisations, extras, bundles, payment methods, channels, staff sales and preparation times. Follow totals down to transactions and customer or company-account activity. Add product costs to compare margins alongside sales.
Can I follow sales while the restaurant is open?
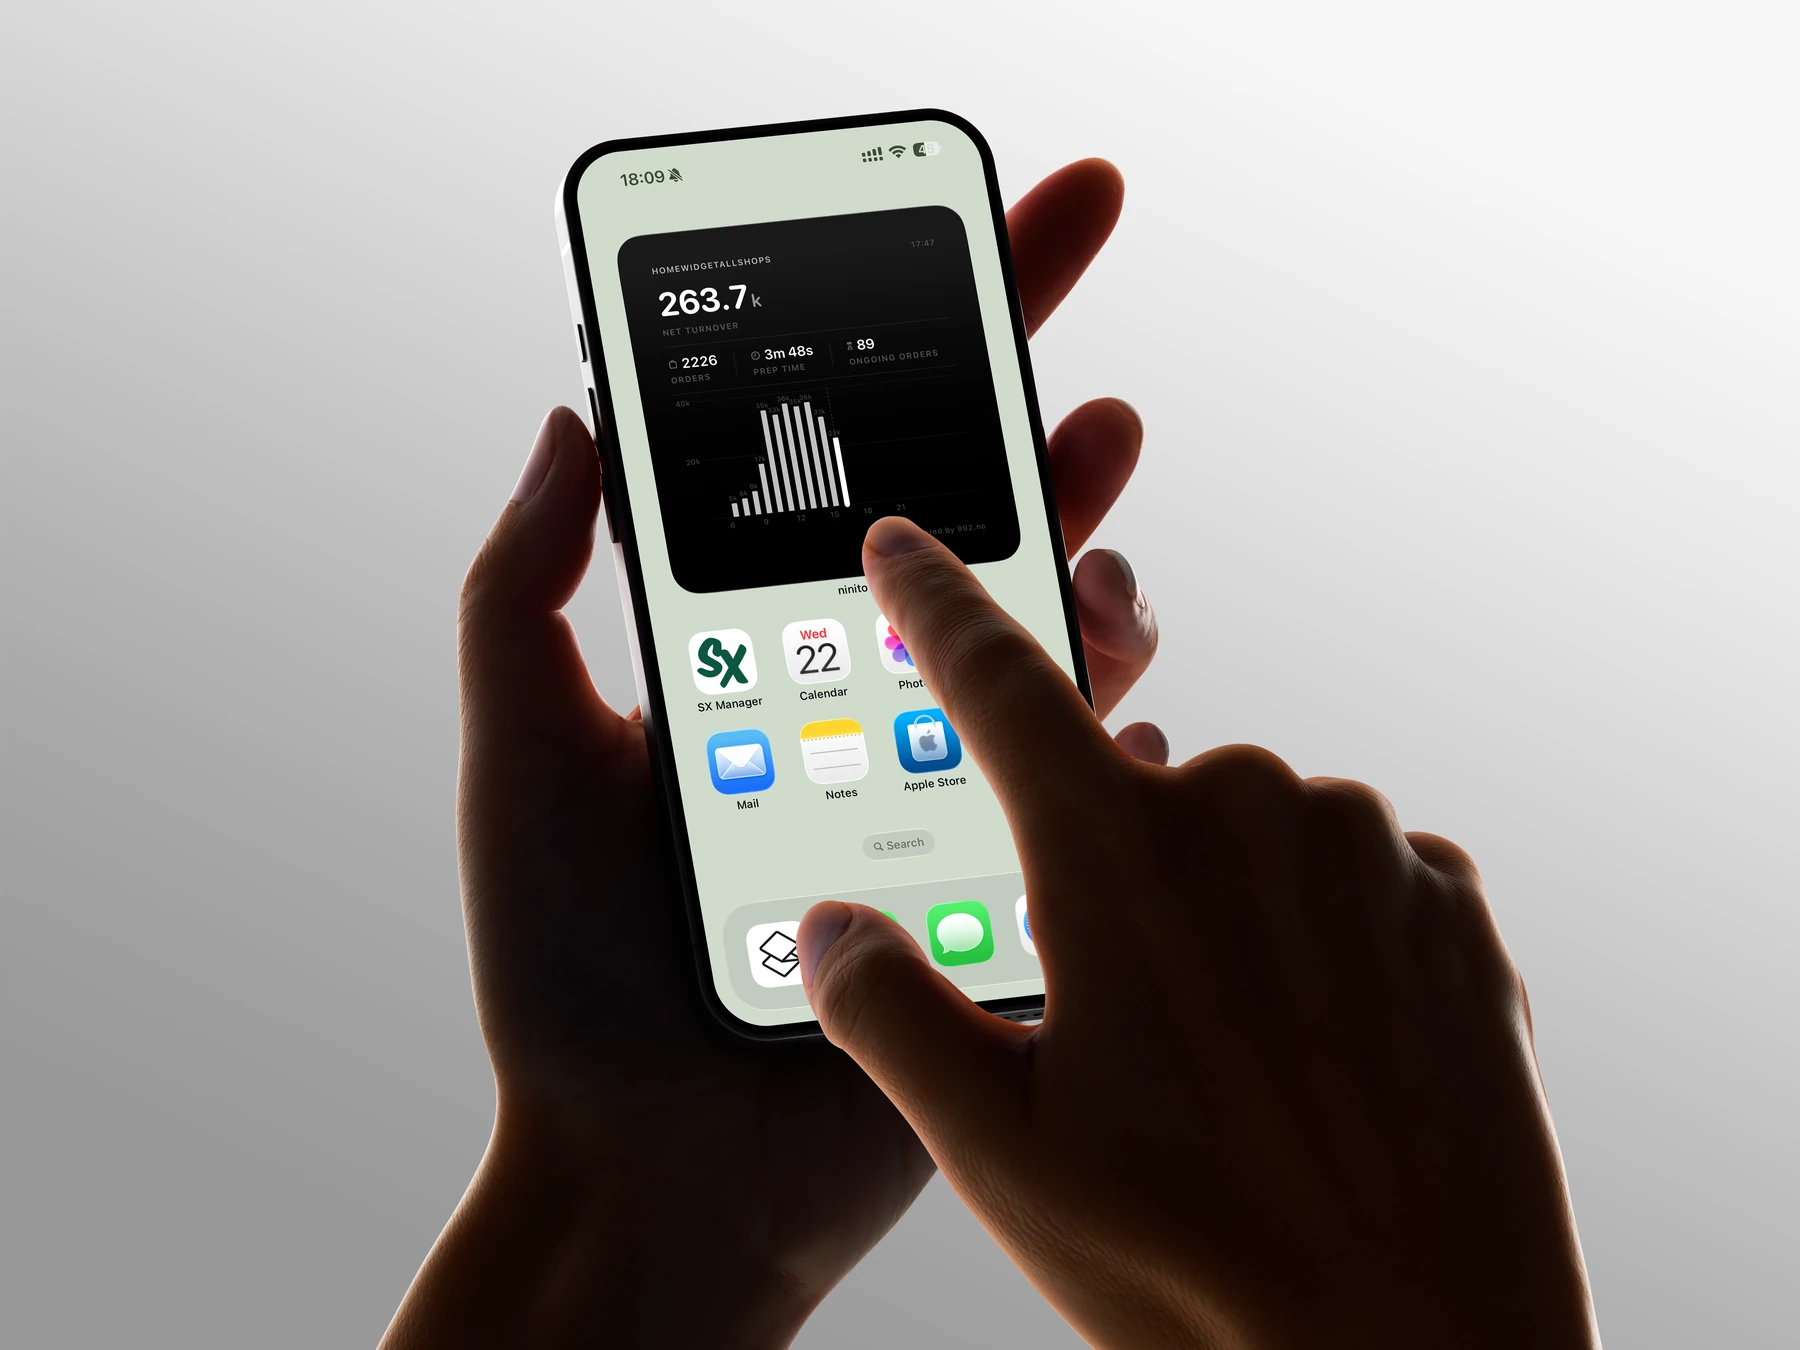
Sales, orders and key figures update live in ninito. Follow service as it happens, compare your restaurants and keep the day’s figures close in the manager app.
Can I see whether guests return without asking them to register?
ninito Pro and Enterprise recognise repeat visits through identifiers, without requiring guests to log in or register. Compare group patterns to understand how guests order and return. Individual guest histories require identification and consent; group insight does not expose a named person’s visit history.
Can I compare regulars with guests who have not returned?
Choose the visit count and period, such as 10+ visits in three months, then compare with guests who have not returned during that period. Explore what each group buys, spends and pays with, where they order, who serves them and how quickly they receive their food.
What is the difference between guest insight and marketing consent?
Group insight helps you understand ordering and return patterns. Personal guest histories use identification and consent, while marketing permission is managed separately. This lets your team learn from the operation while respecting each guest’s choices.
Can guest insights help improve our menu and service?
See which dishes appear most often among regulars and among guests who have not returned. Compare who served those groups and how long their food took. Use the patterns to choose a dish or service detail to improve, then follow how guest behaviour changes.
Can I see how often guests come back?
Measure the average time between visits and compare it with your industry benchmark. Follow the same measure over selected periods to see whether guests are returning more often as you improve your menu, service and offers.
How closely can I compare days and busy periods?
Go down to a day or an hour, or combine every Monday over the last six months. Apply the same filters to frequent guests and guests who have not returned. Compare demand, products, staff sales and preparation times to plan food preparation and staffing around the patterns.
How can I assess a campaign?
Look beyond the sales spike. Compare repeat visits, purchases, offer and reward use, and basket size before, during and after the campaign. Use comparable periods to see what changed, whether guests kept coming back and which results you want to build on.
Can I compare several restaurants and control who sees the figures?
ninito Pro and Enterprise bring your restaurants and concepts into group-wide reporting. Give local managers their own restaurant, regional managers selected locations and head office the full picture. Compare performance across the group, with live key figures available in the manager app.
Can I use ninito data in Power BI or other reporting tools?
Take ninito data into your own analysis tools through exports and Enterprise APIs and webhooks. Set up a data flow to Power BI or your data warehouse, with the relevant data and access permissions for your team.